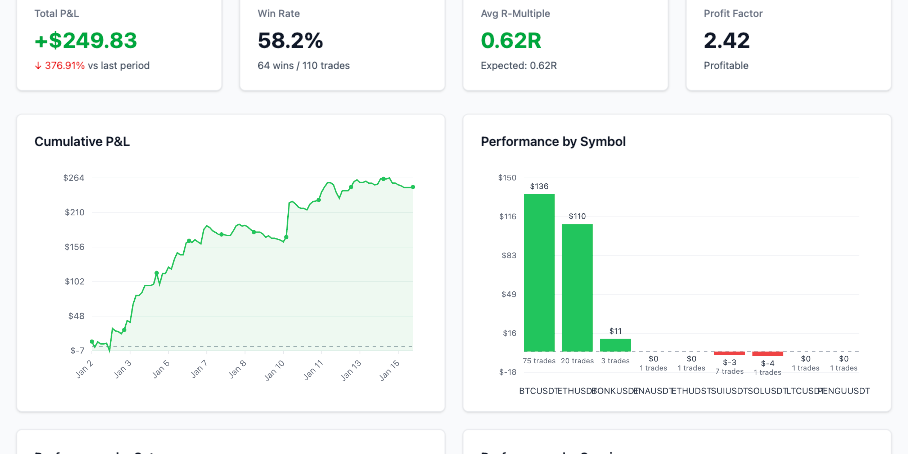
Ask traders how their strategy is doing and most will quote a win rate. But a 70% win rate can lose money, and a 35% win rate can be excellent. The number that actually answers "does this strategy make money?" is expectancy: the average amount you earn per trade.
The Expectancy Formula
Measured in R — where 1R is the amount you planned to risk on a trade — expectancy is:
Expectancy = (Win rate × Average win) − (Loss rate × Average loss)
Loss rate is simply 1 minus the win rate. Average win and average loss are both expressed in R, and the average loss is entered as a positive number.
If you are not yet measuring trades in R, start with how to calculate R-multiple. Every number in this article depends on it.
Three Worked Examples
1. Low win rate, big winners
Win rate 40%, average win 2.5R, average loss 1R.
Expectancy = 0.40 × 2.5 − 0.60 × 1 = 1.00 − 0.60 = +0.40R per trade. Losing more often than winning, and still clearly profitable.
2. High win rate, small winners
Win rate 60%, average win 0.8R, average loss 1.2R.
Expectancy = 0.60 × 0.8 − 0.40 × 1.2 = 0.48 − 0.48 = 0.00R. Six winners out of ten, and the strategy goes nowhere. This is the classic pattern of cutting winners early and letting losers run past the stop.
3. A thin edge
Win rate 55%, average win 1R, average loss 1R.
Expectancy = 0.55 − 0.45 = +0.10R. Positive, but fragile: fees and slippage of 0.05R per trade would cut it in half.
Try your own numbers in the trading expectancy calculator.
From R to Money
Expectancy in R becomes money once you know your risk per trade. With a 10,000 account risking 1% (100) per trade, an expectancy of +0.40R is worth about 40 per trade on average — roughly 4,000 over 100 trades, before costs and ignoring compounding. The same strategy at 0.5% risk earns half as much, with half the drawdown.
This is why expectancy in R is the better way to judge a strategy: it separates the quality of the system from how aggressively you size it.
How Many Trades Do You Need?
Expectancy from ten trades is mostly noise. A rough way to see this: if your trade results have a standard deviation of about 1.5R, the uncertainty around your average shrinks with the square root of the number of trades.
- 30 trades: uncertainty of roughly ±0.27R — an estimate of +0.20R could easily be zero.
- 100 trades: roughly ±0.15R — the picture starts to firm up.
- 300 trades: roughly ±0.09R — now small differences between setups become meaningful.
Treat early expectancy as a hint, keep journaling, and compare setups only once each has a reasonable sample.
Four Ways to Raise Expectancy
- Cut the negative-expectancy setups. Break expectancy down by setup in your journal. One weak setup can drag down an otherwise strong strategy.
- Stop losses from growing past 1R. If your average loss is 1.3R, you are moving stops or exiting late. Bringing it back to 1R raises expectancy without a single extra winner.
- Let winners reach target. Compare your average win with your planned reward-to-risk. The risk reward calculator shows the planned number; your journal shows what you actually captured.
- Trade only where you have an edge. Segment by session, market and time of day. Expectancy often differs sharply between them.
Do Not Forget Costs
Commission, spread and slippage are a fixed drag on every trade. For swing traders they are small; for scalpers they can be the difference between a positive and negative strategy. Log commission on every trade so your expectancy reflects what you actually keep — see the scalping journal page for why this matters most at high frequency.
Conclusion
Win rate tells you how often you are right. Expectancy tells you whether being right pays. Calculate it in R, give it enough trades to mean something, and use your journal to find which setups, sessions and habits push it up or down.
CTA: Alpha Charts calculates win rate, average R and expectancy from your journal automatically. Import your last 100 trades and see your real number.