Most traders track the wrong numbers. Win rate and total PnL look impressive on a spreadsheet, but they rarely tell you why you are winning or losing. Alpha Charts helps you focus on metrics that drive performance, not just vanity statistics.
Define the Core Problem
Traders often overemphasize win rate and ignore risk-adjusted performance.
- High win rate with poor risk/reward still loses money
- PnL hides volatility and emotional risk-taking
- No insight into which setups actually work
Professional Perspective
Professionals measure edge using expectancy, drawdown, and efficiency. These metrics reveal whether a strategy is scalable and repeatable.
The 6 Metrics That Matter Most
- Expectancy: Average R per trade, not dollars
- Profit Factor: Gross wins divided by gross losses
- MAE/MFE: How far trades move against/for you
- Hold Time: Whether you exit too early or late
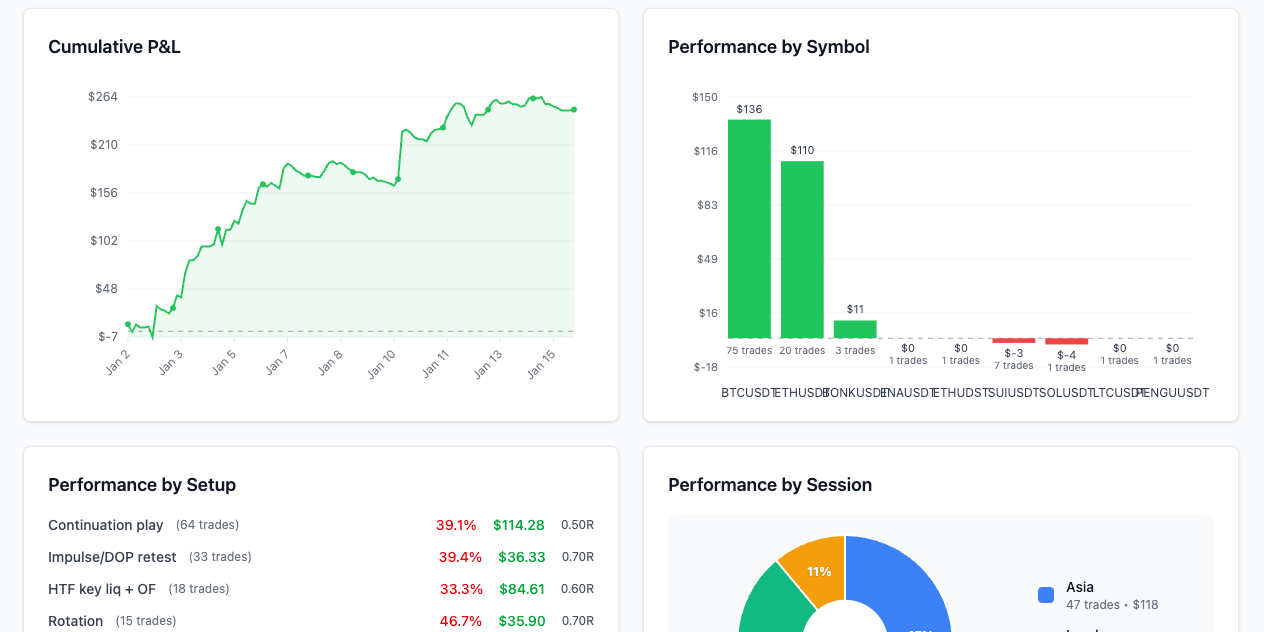
- Setup ROI: Performance by tagged setup
- Max Drawdown: Your true stress test
"If you cannot measure it, you cannot improve it."
How to Apply This Using Alpha Charts
- Tag each trade with setup, market condition, and intent
- Track R-multiples to standardize results
- Compare best and worst trades by time of day
Step-by-Step Action Plan
- Choose 3 core metrics to review weekly
- Filter by setup and note which metrics improve
- Remove setups with negative expectancy
- Adjust risk rules based on drawdown behavior
Common Mistakes to Avoid
- Chasing a higher win rate at the expense of R/R
- Ignoring MAE and repeating the same stop errors
- Judging performance on too few trades
Conclusion
Tracking the right metrics turns a journal into a performance engine. The goal is not more data, but better decisions.
CTA: Start measuring expectancy and drawdown today to see your true edge.
UPDATED · January 16, 2026Trading Metrics